Laboratory examples of metabolic health markers used in cellular and mitochondrial research fall into a short, working list: oxygen consumption rate (OCR) via respirometry, ATP levels and adenylate energy charge, the NAD+/NADH ratio, citrate synthase activity, mitochondrial membrane potential (ΔΨm), reactive oxygen species (mitochondrial versus cytosolic), targeted metabolomics with stable-isotope flux, and signaling readouts along the AMPK/SIRT1/PGC-1α axis. OCR, citrate synthase, and ΔΨm are first-line: fast, well-validated, and high-yield for an initial screen. Metabolomics, isotope tracing, and complex-specific enzymatic assays are follow-up tools you reach for once initial screening flags something worth chasing.
- OCR/respirometry — basal, ATP-linked, and maximal respiration; first-line, high yield.
- ATP and adenylate energy charge — composite energy status; first-line.
- NAD+/NADH ratio — redox state; first-line, handling-sensitive.
- Citrate synthase activity — mitochondrial content proxy; first-line.
- Mitochondrial membrane potential (ΔΨm) — drives ATP synthesis, flags complex-specific defects; first-line.
- Mitochondrial and cytosolic ROS — oxidative stress compartments; first-line screen, follow-up for mechanism.
- Targeted metabolite panels and 13C flux — substrate preference and pathway flux; follow-up.
- AMPK/SIRT1/PGC-1α signaling — transcriptional and energetic sensing; follow-up, context-dependent.
Key Takeaways
Robust metabolic research depends on combining functional markers like OCR and ΔΨm with biochemical and signaling readouts rather than relying on any single measurement.
| Point |
Details |
| Start with first-line markers |
Run OCR, ATP, NAD+/NADH, citrate synthase, ΔΨm, and mitochondrial ROS before adding follow-up assays. |
| Protect nucleotide data |
Snap-freeze and quench samples immediately; NAD+/NADH degrades within seconds at room temperature. |
| Match method to question |
Use intact cells for a physiological snapshot and permeabilized protocols for complex-specific capacity. |
| Separate ROS compartments |
Measure mitochondrial ROS (MitoSOX) and cytosolic ROS (DCFDA) independently since they can dissociate from ATP changes. |
| Source reagents with documentation |
Synthrolab provides batch-tested research peptides and compounds with certificates of analysis for lab studies. |
Table of Contents
Six functional groups cover most experimental questions in mitochondrial and cellular metabolism research.
- Functional respiration answers “how much oxidative capacity exists?” Representative assay: Seahorse XF respirometry. Moderate throughput, moderate cost.
- Membrane potential answers “is the proton gradient intact?” Representative assay: TMRE/TMRM staining. Fast, low sample requirement.
- Redox and nucleotide pools answer “what’s the energetic and redox state?” Representative assay: LC-MS/MS nucleotide panels. Moderate throughput, needs rapid quenching.
- Enzymatic content proxies answer “how much mitochondria is present?” Representative assay: citrate synthase activity. Fast, cheap, scalable.
- Metabolomics/flux answers “which substrates are actually being used?” Representative assay: 13C-tracer LC-MS/MS. Low throughput, resource-intensive.
- Signaling sensors answer “how is the cell regulating its metabolic program?” Representative assay: phospho-AMPK western blot. Moderate throughput, semi-quantitative.
No single group tells the whole story. A defect in OCR without a matching ΔΨm or metabolomic signature usually means you’re looking at only part of the mechanism.
How Do You Measure Oxygen Consumption Rate and Interpret It?
OCR gives you an integrated, quantitative readout of oxidative metabolism, and it’s usually the first assay researchers run because it separates cleanly into functional components. Basal OCR reflects resting oxygen use. Adding oligomycin blocks ATP synthase, and the drop that follows is your ATP-linked respiration. FCCP then uncouples the mitochondria entirely, revealing maximal respiration; subtract basal from maximal and you get spare respiratory capacity, a common flag for stressed or reserve-depleted cells. Rotenone and antimycin A shut down complex I and III, exposing non-mitochondrial oxygen consumption as background.
Platform choice matters. Seahorse XF instruments run multi-well kinetic assays with strong throughput and are the default in most mitochondrial biology labs. Plate-based oxygen-sensitive dyes cost less but sacrifice some kinetic resolution. Clark-type electrodes remain useful for single high-precision measurements but don’t scale well across conditions.
- Basal, ATP-linked, and maximal OCR each isolate a different part of the respiratory chain’s behavior.
- Spare capacity often reveals a defect that basal OCR alone misses.
- Permeabilized-cell follow-ups with saponin or recombinant perfringolysin O (rPFO) let you feed specific substrates directly to the electron transport chain, attributing a defect to substrate oxidation or ATP synthesis machinery rather than guessing from an intact-cell curve.
Pro Tip: Run your oligomycin and FCCP titration on a pilot plate before committing serum, drug, or peptide-treated samples. Getting the uncoupler concentration wrong wastes an entire experimental run, not just one well.
Mitochondrial Membrane Potential: What TMRE and TMRM Reveal

Membrane potential (ΔΨm) measures the proton gradient across the inner mitochondrial membrane, the actual driving force behind ATP synthesis. Lipophilic cationic dyes like TMRE and TMRM accumulate inside mitochondria in proportion to that potential, and you can read the signal by fluorescence microscopy, flow cytometry, or plate reader depending on whether you need single-cell resolution or population averages.
Combining OCR with membrane potential and metabolomics helps separate substrate preference from raw respiratory capacity, since ΔΨm can catch a complex-specific problem, say, a complex I defect versus a complex V defect, that a bulk OCR curve alone tends to blur together.
- Dye concentration and loading time affect signal linearity; too much dye causes self-quenching and gives a false low reading.
- Flow cytometry and plate-based formats need larger cell numbers than single-cell microscopy.
- Choose ΔΨm over OCR when your sample size is limited or when you need single-cell resolution rather than a population average.
Steady-state metabolomics, typically run on LC-MS/MS, gives you a snapshot of metabolite pool sizes at one moment: how much citrate, lactate, or acetyl-CoA is present right now. Stable-isotope tracing, using labeled substrates like 13C-glucose or 13C-glutamine, tracks where carbon actually goes over time. That distinction matters because pool size and flux don’t always move together.
A concrete example: mitochondrial pyruvate carrier (MPC) inhibition reduces citrate abundance and lowers 13C enrichment into TCA intermediates even in cases where OCR looks unchanged. Without the tracer data, you’d miss that the cell has shifted its substrate oxidation pattern despite maintaining similar oxygen consumption.
Both approaches share the same instrumentation demands. A validated LC-MS/MS method can quantify ATP, ADP, AMP, NAD+, NADH, and short-chain acyl-CoAs simultaneously, but only when samples are quenched fast and run against stable-isotope internal standards.
- Steady-state panels answer “what’s here”; isotope tracing answers “where did it come from and where did it go.”
- Extraction protocol and internal standards determine whether your data is quantitative or just qualitative noise.
- Flux modeling requires enrichment data plus a defined metabolic network, not just raw mass spec peaks.
Citrate Synthase, Complex Assays, and ATP as Content and Energy Proxies
Citrate synthase activity is a widely used proxy for mitochondrial content, and researchers commonly normalize other functional readouts, OCR or ΔΨm, against it so a change in mitochondrial number doesn’t get misread as a change in mitochondrial function.
Complex I through IV enzyme assays and blue-native gel approaches go a level deeper, isolating activity at a specific point in the electron transport chain. They’re essential when you already suspect a specific complex is the problem, optional when you’re just screening broadly.
ATP itself gets measured through luciferase-based kits for speed or HPLC/LC-MS for precision. Reporting the adenylate energy charge, a ratio built from ATP, ADP, and AMP together, tends to stay more stable and interpretable than any single nucleotide value alone.
- Normalize functional data to citrate synthase activity before comparing across treatment groups.
- Reserve complex-specific enzyme assays for confirming, not discovering, a suspected defect.
- Report adenylate energy charge alongside raw ATP, ADP, and AMP concentrations.
Measuring NAD+/NADH and ROS Without Fooling Yourself
NAD+/NADH ratio measurement is only as good as your sample handling. Rapid quenching and snap-freezing are non-negotiable, since these nucleotides degrade within seconds at room temperature. LC-MS/MS and enzymatic cycling kits are the two standard approaches, and both are sensitive to handling delays and require internal standards to be trustworthy.
ROS measurement carries its own trap. MitoSOX targets mitochondrial superoxide specifically, while DCFDA reads broader cytosolic oxidative signals, and mixing them up leads to misattributed results. Genetic perturbations of electron transport chain subunits can affect mitochondrial and cytosolic ROS differently, and ROS changes don’t reliably track with ATP changes, so a rise in ROS doesn’t automatically mean a drop in energy output.
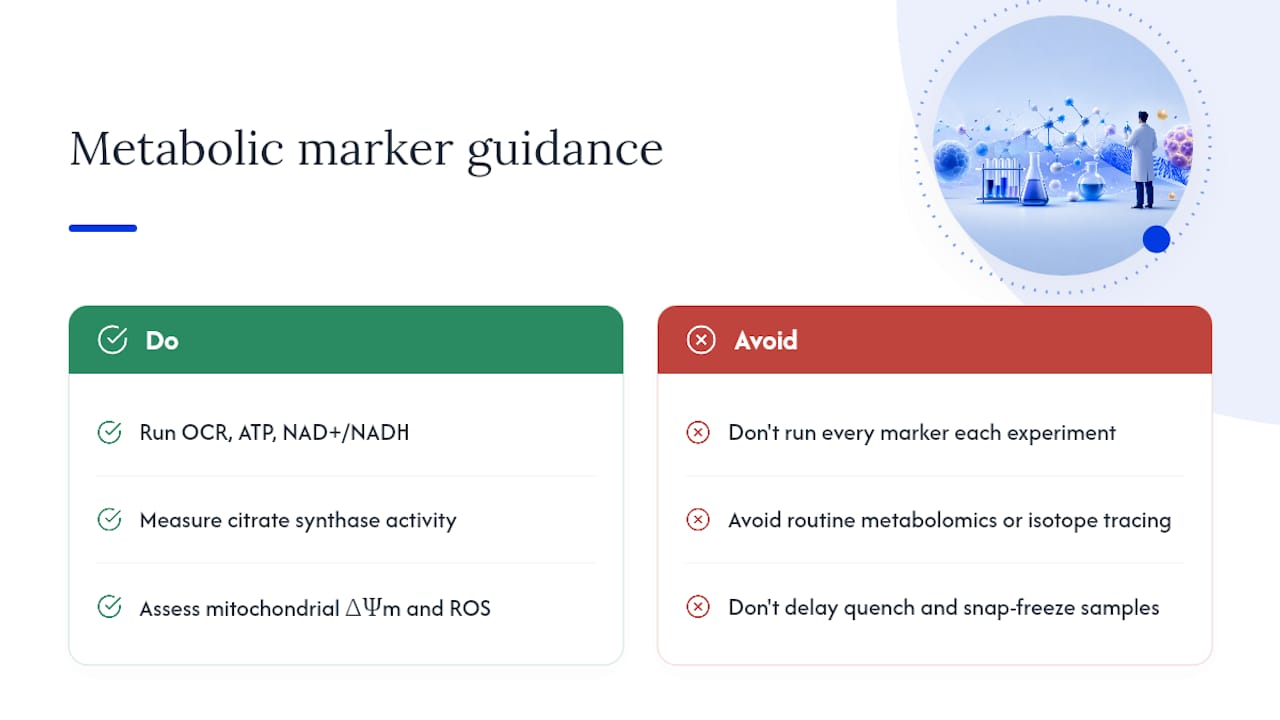
- Snap-freeze samples within seconds of collection for nucleotide work.
- Match your probe (MitoSOX for mitochondrial, DCFDA for broader cytosolic signal) to the compartment you’re actually asking about.
- Pair redox and ROS data with OCR, ΔΨm, or metabolomics before drawing a mechanistic conclusion.
Pro Tip: Keep a dedicated, pre-chilled quench buffer at the bench during every NAD+/NADH collection. The few seconds it takes to reach for a reagent across the room can shift your ratio measurably.
AMPK acts as the cell’s energy sensor: it activates when ATP falls relative to AMP, and that activation raises NAD+ levels enough to potentiate SIRT1, which then deacetylates PGC-1α to trigger mitochondrial biogenesis programs. It’s a genuinely elegant feedback loop, and it’s also why signaling data is often used to explain shifts you already saw in OCR or NAD+/NADH.
Standard assays include phospho-AMPK western blots, SIRT1 activity assays, and PGC-1α acetylation status. Treat these as context, not standalone proof. Read more on the AMPK–SIRT1–PGC-1α pathway for the full mechanistic picture.
- Phospho-AMPK signal reflects activation state, not absolute AMPK protein level.
- SIRT1 activity assays are indirect and benefit from pairing with NAD+/NADH data.
- Interpret signaling readouts alongside a functional marker like OCR or ΔΨm, never in isolation.
Sample Handling, Cell Prep, and Controls That Protect Your Data
Getting a clean marker panel depends more on procedure than on instrument sensitivity.
- Snap-freeze and quench fast. Metabolite and nucleotide pools shift within seconds; NAD+/NADH is particularly sensitive to handling delays, so build quenching into your collection step, not after it.
- Choose intact or permeabilized cells based on the question. Intact-cell respirometry captures a physiological snapshot; permeabilized protocols using saponin or rPFO isolate complex-specific capacity but typically add six to eight hours of preparative work.
- Build in the right controls. Pathway inhibitors and uncouplers (oligomycin, FCCP, rotenone/antimycin), stable-isotope internal standards, and adequate biological replicates all belong in the design from the start, along with an aliquoting plan that keeps one freeze-thaw cycle from degrading three different assays’ worth of sample.
Pro Tip: Aliquot lysate into single-use portions immediately after collection. Repeated freeze-thaw cycling is a quiet but common source of irreproducible NAD+/NADH and ATP data.
A minimal first-line panel covers most screening questions without excessive resource commitment: OCR via Seahorse, ATP via luciferase assay, NAD+/NADH ratio, citrate synthase activity, ΔΨm, and mitochondrial ROS. Each one is fast, validated, and answers a distinct question about capacity, content, or redox state.
Once that panel flags something worth pursuing, an extended follow-up set makes sense: targeted metabolomics with 13C tracing, complex-specific enzyme assays, and SIRT1/AMPK signaling readouts.
- Confirm sample size is adequate for both functional and biochemical assays before starting.
- Decide upfront which assays can share one lysate aliquot and which need a dedicated, separately frozen sample.
- Include inhibitor/uncoupler controls and biological replicates in the initial design, not as an afterthought.
- Run the first-line panel across all conditions.
- Flag any condition showing a functional or redox anomaly.
- Apply the extended panel only to flagged conditions to conserve reagents and instrument time.
What Actually Separates a Useful Marker Panel From a Wasted One
Most mistakes in this field come from treating one marker as the whole answer. An OCR curve that looks fine can still hide a substrate-switching problem that only isotope tracing catches. A ROS spike doesn’t automatically mean an energy crisis, and treating it that way sends researchers chasing the wrong mechanism. The panels that hold up under scrutiny are the ones built from orthogonal readouts, functional, biochemical, and signaling, cross-checked against each other rather than any single number carrying the conclusion.
Running a panel like this means your OCR, ATP, and NAD+/NADH data are only as reliable as the compounds and reagents behind them. Synthrolab supplies research-grade peptides and laboratory compounds with independent batch testing and certificates of analysis, along with reconstitution solutions built for consistent prep across replicate runs.
For background on the signaling markers covered in the AMPK/SIRT1/PGC-1α section, Synthrolab’s guide on cellular signaling breaks down the mechanisms in more depth, and the peptide quality and reagent guide covers what to look for in a research-grade supplier before your next order. All products are sold strictly for laboratory research use. Browse the current catalog at Synthrolab to line up reagents before your next experimental run.
Frequently Asked Questions
What are the most common examples of metabolic health markers in mitochondrial research?
OCR/respirometry, ATP and adenylate energy charge, NAD+/NADH ratio, citrate synthase activity, mitochondrial membrane potential, ROS, targeted metabolomics with isotope tracing, and AMPK/SIRT1/PGC-1α signaling readouts make up the core list researchers reach for.
Do I need to run every marker in every experiment?
No. A first-line panel, OCR, ATP, NAD+/NADH, citrate synthase, ΔΨm, and ROS, covers most screening questions. Reserve metabolomics, isotope tracing, and complex-specific enzyme assays for conditions that flag an anomaly in the first-line panel.
Why does OCR sometimes look normal when a metabolic defect is real?
OCR measures overall oxygen consumption, not which substrate is being oxidized. Isotope tracing can catch a substrate-switching problem, like reduced glucose oxidation into the TCA cycle, that OCR alone misses entirely.
How should I handle samples for NAD+/NADH measurement?
Quench and snap-freeze samples within seconds of collection. NAD+/NADH values shift fast at room temperature, and delayed handling is one of the most common sources of unreliable redox data in this kind of work.
Sources
Recommended
 21+ verification