Treat a single flagged value as a prompt to check context, controls, and trends — not as a verdict. When an unexpected result appears in your peptide or biochemical assay, the first move is not to redesign the experiment. It is to run a short triage. Check sample identity, confirm units match the assay method, pull the COA and lot number, verify fasting or prep metadata, and look at the prior trend for that analyte. Panels and trends across time are almost always more informative than a single data point. Synthrolab’s author Mitch grounds this guidance in laboratory-grade COA documentation and practical bench experience with peptide assays.
- Sample identity: confirm tube label, patient/subject ID, and collection timestamp
- Units: verify the report units match your assay’s calibration (pg/mL vs. ng/mL is a 1,000-fold difference)
- COA and lot: pull the reagent certificate of analysis and confirm the lot matches what was used
- Fasting/prep metadata: collection time, fasting duration, and specimen type (plasma vs. serum) all shift baselines
- Prior trend: one elevated value in a downward series reads very differently than a first-ever spike
Pro Tip: About 1 in 20 healthy individuals will fall outside a reference range on any single test by chance alone. If you run 20 analytes in one panel, expect at least one flag even in a perfectly healthy sample.
Table of Contents
What should you check first when a lab value surprises you?
A fast, structured triage prevents wasted repeats and misdirected follow-up experiments.
- Metadata first: Collection time, specimen type, and fasting status can shift a baseline reading by 20–40% for some analytes. Confirm these before anything else.
- Sample identity and units: Cross-check the subject ID against the run sheet. Confirm the unit reported matches the assay’s calibration standard.
- Assay controls and COA: Review the run’s positive and negative controls. If controls are out of range, the sample result is uninterpretable regardless of the value.
- Pre-analytical causes: Hemolysis, lipemia, delayed centrifugation, and anticoagulant errors are the most common sources of spurious elevations in peptide ELISAs.
- Immediate decision: Repeat the same aliquot, request a fresh draw, or escalate if the value crosses a critical threshold.
Pro Tip: When flagging a result to a collaborator, anchor your message to specifics: “Sample 14B, IGF-1 at 312 pg/mL on March 3, versus a group mean of 187 pg/mL.” Vague concern prompts vague responses.
How does the three-pass method help you read a paper tied to your finding?
The three-pass approach is the fastest way to decide whether a paper is relevant and trustworthy before you commit an hour to reading it fully.
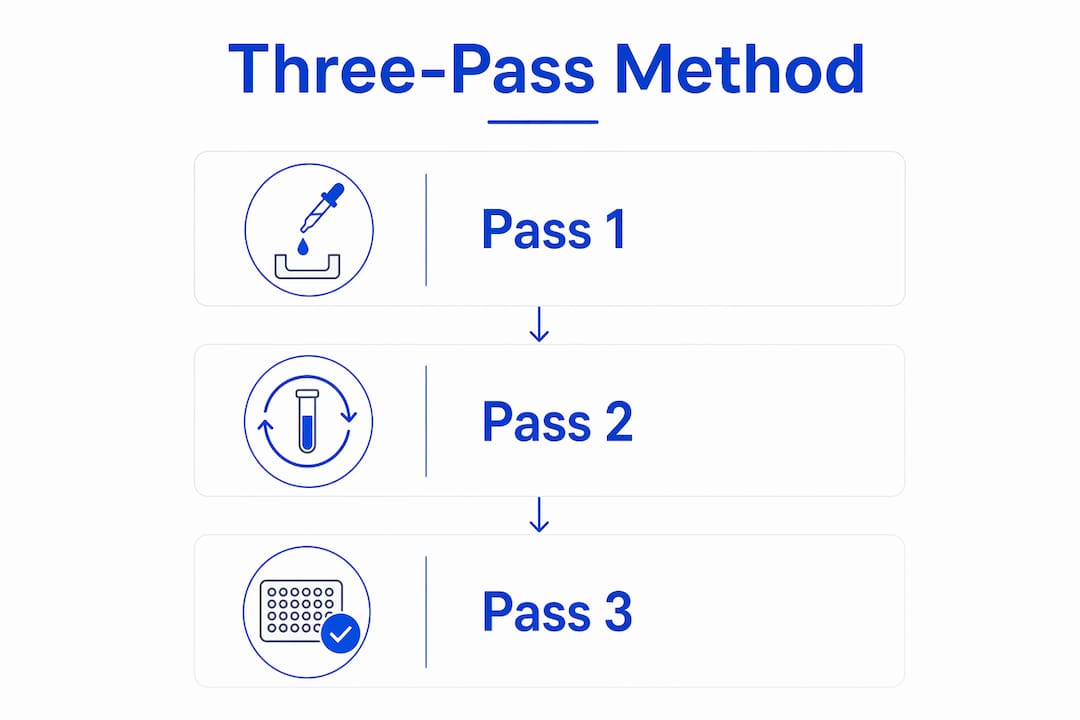
Pass 1 — Screen for relevance: Read the abstract, the final paragraph of the Introduction, and the Conclusion. Ask whether the assay type, peptide system, and sample population overlap with yours. If they do not, stop.
Pass 2 — Scrutinize methods and data: Read Methods, Figures, and Results line by line. Pull the assay’s limit of detection (LOD), limit of quantification (LOQ), calibration range, and sample prep protocol. StatPearls guidance recommends confirming reproducibility signals here before reading the Discussion.

Pass 3 — Synthesize against your own conditions: Compare the paper’s raw data and assay specs to your protocol. Note every gap: different matrix, different LOD, different species. These gaps define what you need to replicate.
Pro Tip: Read the Discussion only after you have formed your own interpretation of the Figures and Tables. Active, independent reading of raw data reduces confirmation bias — you stop looking for the paper to confirm what you already believe.
What is the four-step workflow for analyzing raw assay data?
A structured workflow keeps analysis decisions visible and reproducible. The four steps below apply whether you are working in Python/pandas, R/tidyverse, or Excel.
| Step |
What to do |
Key checks |
Common tools |
| 1. Clean |
Remove duplicates, fix unit errors, flag outliers, pair samples |
Missing value audit, unit harmonization |
pandas dropna(), Excel data validation |
| 2. Summarize |
Compute mean, median, SD, CV%; plot distributions |
CV% >15% flags assay noise; boxplots reveal spread |
R summary(), Excel pivot |
| 3. Explore/Test |
Choose statistical test, correct for multiple comparisons, estimate effect size and CI |
t-test, ANOVA, or Mann-Whitney; Bonferroni or FDR correction |
R lm(), Python scipy.stats |
| 4. Interpret |
Integrate statistics with biological plausibility, LOD/LOQ, and metadata |
Is the effect above the assay’s LOQ? Does it make mechanistic sense? |
Narrative + COA cross-check |
Initial data analysis frameworks stress that maintaining a structured workflow is a fundamental step toward reproducible research. Save your analysis scripts with a fixed random seed, and attach raw data files and COAs to the project repository before sharing results.
Does statistical significance mean the result is biologically meaningful?
No. A low p-value tells you the result is unlikely under the null hypothesis. It says nothing about whether the effect is large enough to matter in your peptide system.
- Check effect size first: Cohen’s d, fold-change, or a normalized ratio against matched controls gives you the magnitude. A p-value of 0.001 on a 4% fold-change in a noisy ELISA is not a finding worth acting on.
- Inspect confidence intervals: A wide 95% CI signals an underpowered experiment. Reading between the lines of a study means asking whether the upper and lower bounds of the CI both cross a threshold that matters biologically.
- Correct for multiple comparisons: Running 20 endpoints without correction inflates false-positive risk substantially. Apply Bonferroni or Benjamini-Hochberg FDR correction before reporting.
- Plot raw data points: Boxplots and strip plots reveal outlier-driven significance that summary statistics hide.
- Bootstrap when n is small: Resampling methods give more stable effect-size estimates when your group sizes are below 10.
A statistically significant result can be mechanistically trivial. Always pair the p-value with an effect size and a biological rationale before changing experimental direction.
What does a flag on a lab report actually mean for your research?
A flag means the value falls outside the lab’s reference interval, which is typically the central 95% of a healthy reference population. The bottom and top 2.5% are excluded by design. That means roughly 5% of healthy samples will be flagged on any given test — not because something is wrong, but because of how the interval is constructed.
For research cohorts, population-derived clinical reference ranges are often the wrong benchmark entirely. A peptide elevation that looks alarming against a general population range may be unremarkable within your experimental cohort.
- Verify the reference interval matches your specimen type, assay method, and population
- Prefer cohort-specific baselines: compute fold-change or z-score against your own matched controls
- Distinguish between a flag that is high relative to the population and one that is high relative to the vehicle control in your experiment
Pro Tip: Within-experiment z-scores against matched controls are more informative than population flags for most peptide assays. A value two standard deviations above your vehicle control is a real signal; a value flagged “H” against a clinical range may not be.
What quality signals tell you a finding is worth trusting?
Confidence in a result scales with the documentation behind it. Before acting on any finding, check these signals.
- Controls: Positive and negative controls must be within acceptance criteria on the same run
- Replicates: Minimum technical triplicates; biological replicates (independent samples) are required before any mechanistic claim
- COA and lot traceability: Every reagent should have a certificate of analysis attached to the experiment record
- Calibration logs: Confirm the instrument was calibrated within the validated window
- Orthogonal confirmation: A result confirmed by a second independent method (e.g., ELISA plus mass spectrometry) carries substantially more weight
- Blinded processing: Where feasible, process samples without knowledge of group assignment
Pro Tip: Keep a reproducibility log: one document per project that records every replication attempt, protocol deviations, lot numbers, and COA links. Attach it to the repository before any data leaves the lab.
How do you apply all of this to an unexpected peptide ELISA elevation?
Scenario: Peptide X is elevated 2.8-fold in the treatment group versus vehicle in a single ELISA run. The result was not expected based on prior literature.
Step A — Immediate checklist: Confirm sample IDs match the run sheet. Check that the reported unit is pg/mL and matches the standard curve range. Pull the COA for the detection antibody lot used. Review the run’s positive control: it passed at 98% of expected. No hemolysis noted. Metadata confirms consistent fasting and collection timing across groups.
Step B — Three-pass literature check: A relevant methods paper passes Pass 1 (same peptide, same matrix). Pass 2 reveals the paper’s LOD is 15 pg/mL; your lowest sample is at 42 pg/mL, so you are above LOD. The assay’s calibration range matches yours.
Step C — Data analysis:
| Sample group |
Raw mean (pg/mL) |
Normalized to vehicle |
Cohen’s d |
| Vehicle |
38.4 |
— |
— |
| Treatment (post-outlier removal) |
96.2 |
2.5 |
1.71 |
A Cohen’s d of 1.71 is a large effect by any standard. The 95% CI does not cross 1.0 after outlier removal.
Decision node: Effect size is large and controls passed. Run a fresh aliquot from a second biological replicate before concluding. If the elevation holds, confirm with an orthogonal method such as LC-MS/MS. Do not redesign the experiment on one run.
Pro Tip: Message template for collaborators: “Treatment group, Peptide X, ELISA run March 10 — mean 96.2 pg/mL vs. vehicle 38.4 pg/mL (2.5-fold, d=1.71). Controls passed. Requesting second biological replicate and LC-MS confirmation before proceeding. COA lot #[X] attached.”
Key Takeaways
Interpreting basic lab research findings correctly requires verifying metadata and assay performance before drawing any biological conclusion from a single flagged value.
| Point |
Details |
| Single flags are prompts, not verdicts |
About 1 in 20 healthy samples falls outside a reference range by chance; always check controls and trend first. |
| Metadata decides comparability |
Specimen type, fasting status, and collection timing can shift baselines significantly; confirm these before repeating an assay. |
| Effect size over p-value |
A Cohen’s d of 1.71 is a large effect; a p-value alone tells you nothing about biological magnitude. |
| Archive COAs and scripts |
Attach raw data, analysis scripts, and COA links to every project repository to support replication. |
| Synthrolab COA documentation |
Synthrolab provides batch-specific COAs for research-grade peptides, supporting the reproducibility checks described throughout this workflow. |
Why the interpretation step is where most peptide research goes wrong
The checklist steps in this article are not complicated. The problem is that researchers skip them under time pressure, or they skip them because a result confirms what they hoped to see. Confirmation bias is the real enemy here, not a noisy ELISA. When a 2.8-fold elevation appears in the treatment group, the instinct is to start writing the mechanism. The discipline is to run the triage first, check the controls, pull the COA, and ask whether the effect holds in a second biological replicate.
Peptide assays are particularly vulnerable to pre-analytical variation. A 30-minute delay in centrifugation, a single freeze-thaw cycle on a degradation-prone peptide, or a lot-to-lot antibody shift can produce fold-changes that look biological but are not. The PGC-1 alpha pathway and similar metabolic cascades involve analytes that are genuinely sensitive to collection conditions. That sensitivity is not a reason to distrust the data. It is a reason to document everything and confirm orthogonally before committing to a conclusion.
Synthrolab resources for reproducible peptide research
Researchers working through the interpretation workflow above need reagents they can actually trust. Synthrolab supplies research-grade peptides with batch-specific certificate of analysis documentation for every product, so you can attach a real COA to your reproducibility log rather than a vendor’s generic spec sheet. The peptide quality and types guide covers purity standards, storage requirements, and what to look for when evaluating a new compound for your assay.
For researchers building out a new protocol or troubleshooting an existing one, the GHK-Cu/BPC-157/TB-500 product page shows exactly how batch documentation is structured. Every order includes the COA, lot number, and storage data you need to complete the quality checklist in this article. Browse the full catalog and documentation at synthrolab.com.
This article is general scientific information, not medical or clinical advice. Confirm current regulatory requirements and consult a qualified professional for your specific research context.
Useful sources
The following references support the guidance in this article and are worth consulting directly for deeper reading.
- Ten Simple Rules for Reading a Scientific Paper — PMC/PLOS Computational Biology. Covers active reading strategies, confirmation bias, and why reading Figures before the Discussion matters.
- How to Read a Scientific Manuscript — StatPearls/NCBI Bookshelf. Structured guidance on reading order, methods scrutiny, and reproducibility screening.
- Three-Pass Approach to Reading Scientific Papers — Original ACM source. The foundational framework for the triage reading method described in this article.
- Initial Data Analysis for Longitudinal Studies — PLOS One. Reproducible IDA framework covering data cleaning, screening, and structured analysis workflows.
- How to Read a Research Paper: Reading Between and Beyond the Lines — PMC. Practical critique of confounding, confidence intervals, and the gap between statistical and real-world significance.
- How to Understand Your Lab Results — MedlinePlus/NIH. Authoritative reference on reference ranges, units, and false positive/negative interpretation.
- How to Read Lab Test Reports — Diagnostic Equity. Practical breakdown of flags, reference intervals, and context-dependent interpretation.
- Synthrolab COA Page — Batch-specific certificate of analysis documentation for all Synthrolab research compounds.
When publishing results, cite the original methods paper for every assay used, attach the COA and QC logs as supplementary material, and archive your analysis scripts with a fixed random seed so any reviewer can reproduce your workflow from raw data.
Recommended