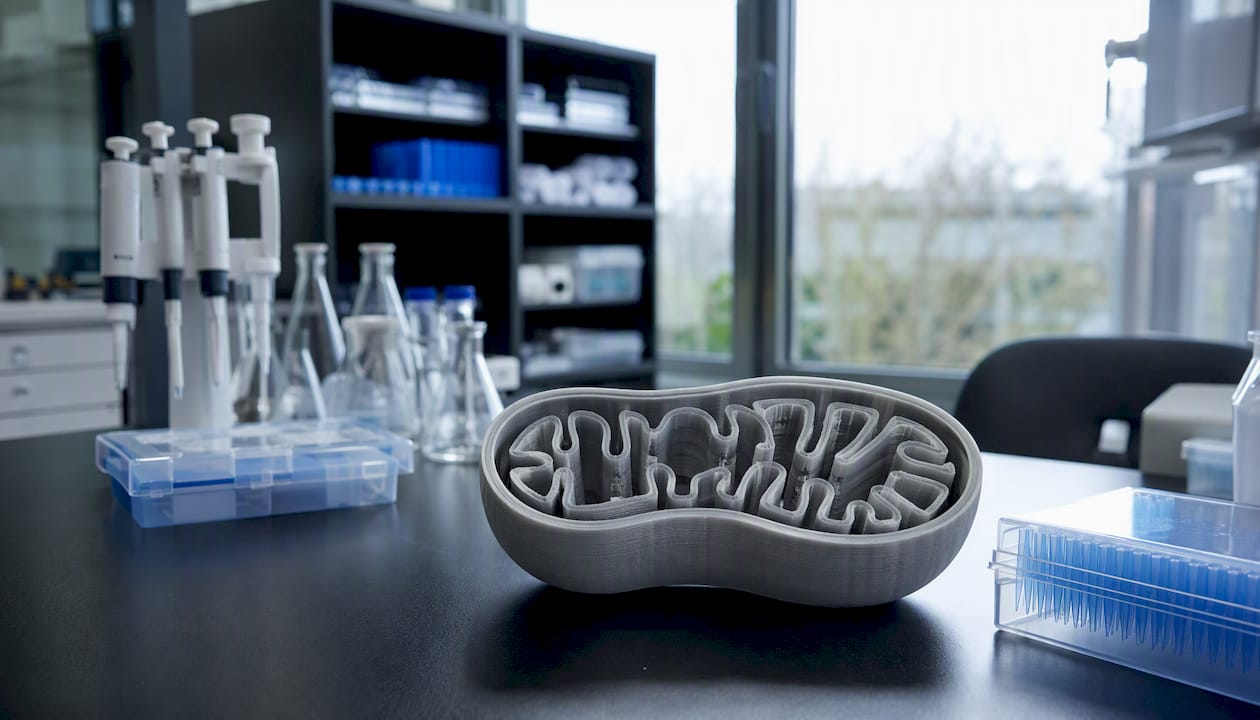
The electron transport chain (ETC) is a series of four membrane-bound protein complexes that strip electrons from NADH and FADH2, use the released energy to pump protons across the inner mitochondrial membrane, and drive ATP synthase to produce the majority of ATP in aerobic cells. According to StatPearls on NCBI, the ETC couples these redox reactions to proton pumping and, together with ATP synthase, performs oxidative phosphorylation. Without it, a single glucose molecule yields only 2 ATP from glycolysis instead of the roughly 30–32 ATP aerobic respiration delivers. The ETC is not a detail of cellular respiration — it is the main event.
Key Takeaways
The electron transport chain is the primary ATP-generating system in aerobic cells, converting redox energy from NADH and FADH2 into a proton gradient that drives ATP synthase to produce roughly 30–32 ATP per glucose.
| Point |
Details |
| ETC definition and location |
Four protein complexes in the inner mitochondrial membrane couple redox reactions to proton pumping. |
| Electron entry points |
NADH enters at Complex I, which pumps protons; FADH2 enters at Complex II, which does not pump protons, resulting in less ATP yield for FADH2. |
| ATP yield estimates |
NADH yields ~2.5 ATP; FADH2 yields ~1.5 ATP; total per glucose is roughly 30–32 ATP. |
| Chemiosmosis drives synthesis |
Proton-motive force (ΔΨ + ΔpH) drives rotational catalysis in ATP synthase to produce ATP. |
| Clinical relevance |
Cyanide and CO block Complex IV; rotenone blocks Complex I; hypoxia halts the chain and causes lactic acidosis. |
Table of Contents
What is the electron transport chain and where does it run?
The electron transport chain in cellular respiration operates along the inner mitochondrial membrane, a highly folded structure whose folds (cristae) dramatically increase surface area for the complexes. The matrix sits on one side, the intermembrane space on the other. Protons pumped outward accumulate in the intermembrane space, building the gradient that powers ATP synthesis. That geometry is not incidental — it is the whole mechanism.
The ETC is not exclusive to mitochondria. In chloroplasts, a photosynthetic version runs along the thylakoid membrane, using light-excited electrons to reduce NADP+ instead of oxygen. In bacteria and archaea, the chain sits in the plasma membrane itself, since prokaryotes have no mitochondria. The underlying logic — redox reactions driving proton pumping driving ATP synthesis — is conserved across all three settings, which tells you how fundamental this process is to life on Earth.
A useful mental picture: imagine the inner mitochondrial membrane as a wall. The four complexes are protein machines embedded in that wall. Mobile carriers ferry electrons between them, and protons pile up on one side until the pressure forces them back through ATP synthase like water through a turbine.
How electrons flow through each complex
The NCBI Bookshelf chapter on oxidative phosphorylation describes the stepwise logic clearly: electrons from NADH enter at Complex I, electrons from FADH2 enter at Complex II, and the energy released at each transfer step is harvested to pump protons rather than lost as heat all at once.
| Complex |
Common Name |
Electron Donor → Acceptor |
H⁺ Pumped (per 2e⁻) |
Key Prosthetic Groups |
| I |
NADH dehydrogenase |
NADH → CoQ |
~4 |
FMN, Fe-S clusters |
| II |
Succinate dehydrogenase |
FADH2 → CoQ |
0 |
FAD, Fe-S clusters, heme b |
| III |
Cytochrome bc1 |
CoQH2 → cytochrome c |
~4 |
Heme b, heme c1, Fe-S (Rieske) |
| IV |
Cytochrome c oxidase |
Cytochrome c → O2 |
~2 |
Heme a, heme a3, Cu centers |
| V |
ATP synthase |
H⁺ gradient → ATP |
(consumes gradient) |
F0 and F1 subunits |
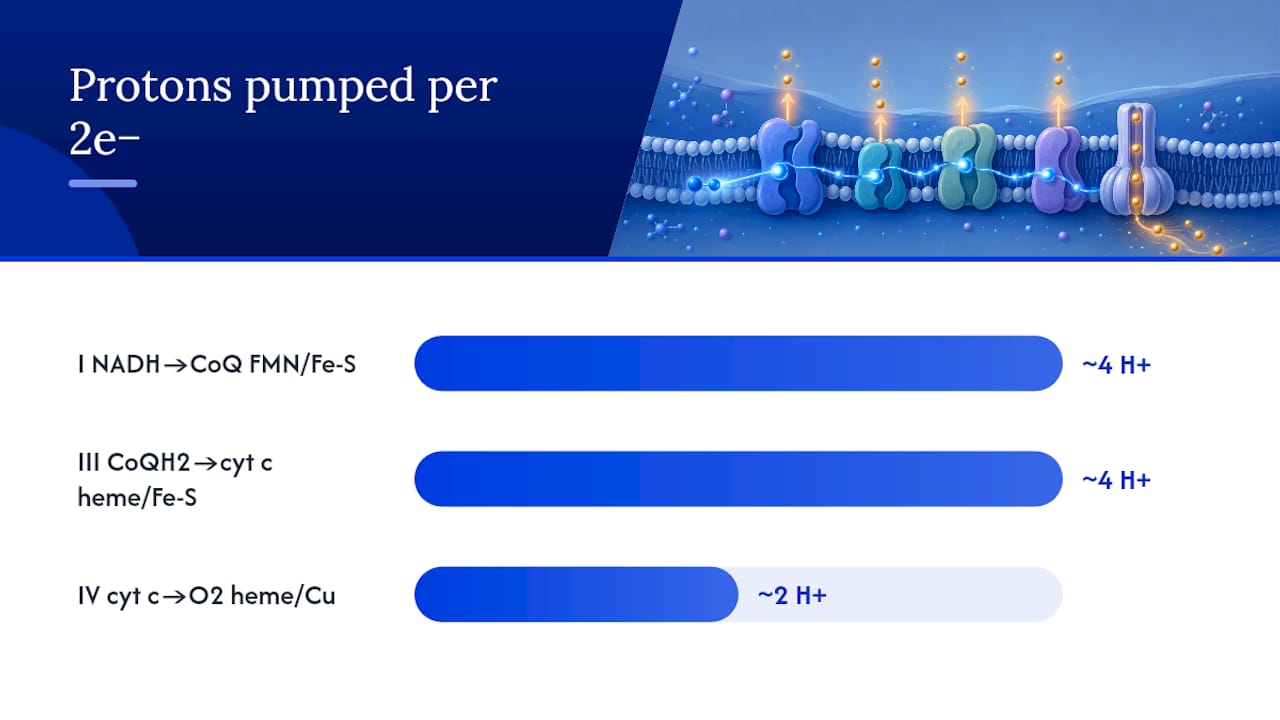
Complex I (NADH dehydrogenase) is the largest complex and the main entry point. It accepts two electrons from NADH via its FMN cofactor, passes them through a chain of iron-sulfur (Fe-S) clusters to ubiquinone (CoQ), and pumps approximately four protons into the intermembrane space per electron pair.
Complex II (succinate dehydrogenase) is the only complex that connects the TCA cycle directly to the ETC. It oxidizes succinate to fumarate, reducing FAD to FADH2 in the process, then passes those electrons to CoQ. Critically, as the University of Illinois succinate dehydrogenase resource notes, Complex II does not pump any protons. That single fact explains most of why FADH2 yields less ATP than NADH.
Ubiquinone (CoQ) is a small, hydrophobic molecule that diffuses freely within the lipid bilayer. It collects electrons from both Complex I and Complex II, becoming ubiquinol (CoQH2), then delivers them to Complex III. Its mobility makes it an efficient electron shuttle between fixed complexes.
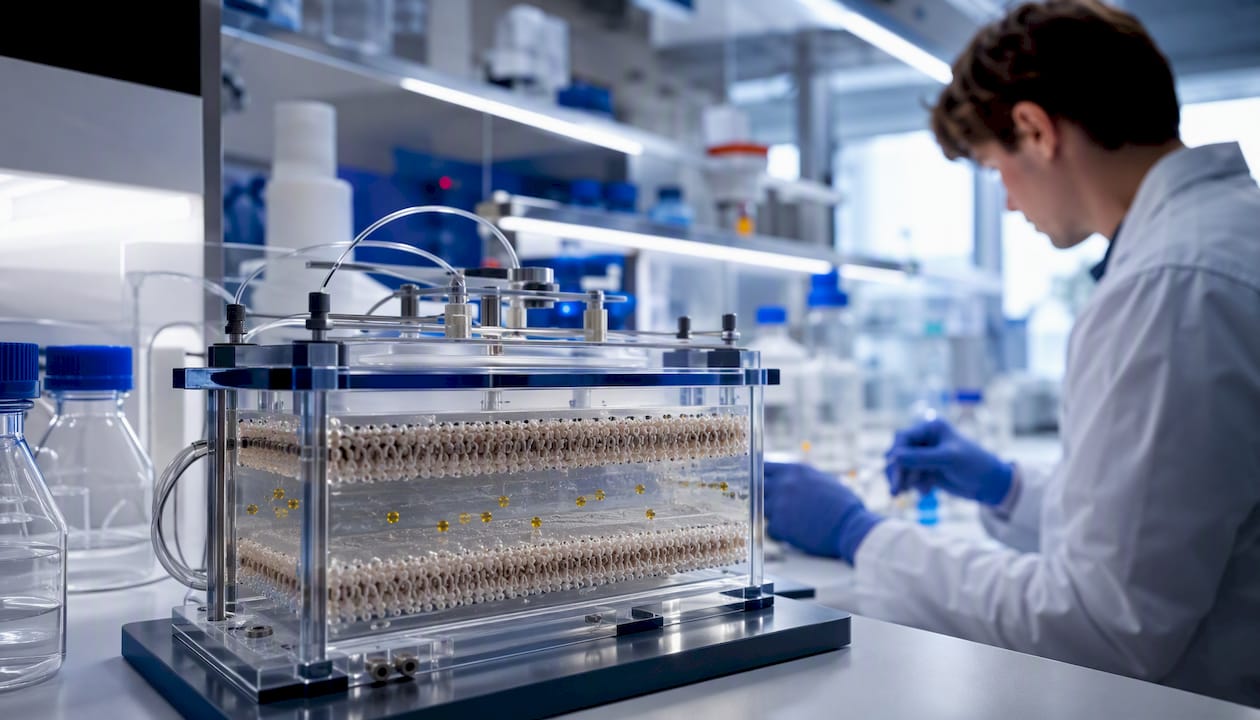
Complex III (cytochrome bc1) runs the Q cycle, a two-step mechanism that recycles a semiquinone intermediate to pump approximately four protons per electron pair while passing electrons one at a time to cytochrome c. The Q cycle is one of the more counterintuitive steps in biochemistry — electrons briefly split paths before rejoining — but the net result is efficient proton translocation.
Cytochrome c is a small, soluble protein that carries electrons one at a time through the intermembrane space from Complex III to Complex IV. Unlike CoQ, it is water-soluble and moves outside the membrane.
Complex IV (cytochrome c oxidase) accepts electrons from cytochrome c and transfers them to molecular oxygen, reducing O2 to water. This is the terminal step of the aerobic electron transport process. It pumps approximately two protons per electron pair and is the step that makes oxygen essential — remove O2, and the entire chain backs up.
Complex V (ATP synthase) is not technically part of the electron transport chain, but it is inseparable from it. Protons flow back through its F0 subunit, driving rotation of the F1 subunit’s central stalk and catalyzing ATP synthesis from ADP and inorganic phosphate.
How does chemiosmosis drive ATP synthesis?
The chemiosmotic hypothesis, developed by Peter Mitchell, explains how the proton gradient becomes chemical energy. The proton-motive force (PMF) has two components: a membrane potential (ΔΨ), generated by the charge difference across the membrane as positively charged protons accumulate in the intermembrane space, and a pH gradient (ΔpH), generated by the concentration difference. Both components drive protons back through ATP synthase.
ATP synthase works by rotational catalysis. Proton flow through the F0 ring causes it to spin. That rotation is transmitted to the F1 catalytic head, where three beta subunits cycle through open, loose, and tight conformations, binding ADP and phosphate and releasing finished ATP. It is a molecular motor, not a simple enzyme.
ATP yield per glucose (approximate):
NADH → ~2.5 ATP per molecule; FADH2 → ~1.5 ATP per molecule.
Total aerobic yield: roughly 30–32 ATP per glucose, depending on shuttle systems and organism.
The older textbook figure of 36–38 ATP assumed 100% efficiency and ignored the cost of transporting ADP and phosphate into the mitochondria. The 30–32 estimate reflects real physiological conditions more accurately.
Why NADH and FADH2 give different ATP yields
Electrons reach the chain from several metabolic pathways. Glycolysis produces cytosolic NADH. Pyruvate oxidation and the TCA cycle generate mitochondrial NADH and FADH2. Beta-oxidation of fatty acids produces both, with a higher proportion of FADH2 per carbon than glucose catabolism.
The yield difference between NADH and FADH2 comes down to entry point:
- NADH donates electrons at Complex I, which pumps ~4 protons. Those protons contribute to the gradient that drives ATP synthase.
- FADH2 donates at Complex II, which pumps zero protons. Electrons skip Complex I entirely, so fewer protons are pumped and less ATP results (~1.5 vs. ~2.5 per molecule).
Cytosolic NADH from glycolysis faces an additional complication. The inner mitochondrial membrane is impermeable to NADH itself, so cells use shuttle systems to transfer the electrons:
- The malate-aspartate shuttle (active in heart and liver) transfers electrons as mitochondrial NADH, preserving the full ~2.5 ATP yield.
- The glycerol-3-phosphate shuttle (active in muscle and brain) transfers electrons as FADH2, dropping the effective yield to ~1.5 ATP per cytosolic NADH.
This is why ATP yield estimates carry caveats — the number depends on which tissues are active and which shuttle dominates.
ETC variants: photosynthesis, bacteria, and anaerobic respiration
The mitochondrial ETC is one version of a universal strategy. In chloroplasts, the photosynthetic electron transport chain runs along the thylakoid membrane. Light energy excites electrons in Photosystem II, which pass through plastoquinone, the cytochrome b6f complex, and plastocyanin to Photosystem I, ultimately reducing NADP+ to NADPH. The direction of electron flow and the terminal acceptor differ entirely from the mitochondrial chain, but proton pumping and ATP synthase remain central.
Bacteria show remarkable diversity. Many use the same four-complex arrangement as mitochondria (consistent with the endosymbiotic origin of mitochondria), but others substitute alternative complexes or electron carriers depending on available substrates and environmental conditions. Some bacteria run branched chains with multiple terminal oxidases tuned to different oxygen concentrations.
When oxygen is absent, many organisms switch to anaerobic respiration using alternative terminal electron acceptors:
- Nitrate (NO3⁻) → used by denitrifying bacteria
- Sulfate (SO4²⁻) → used by sulfate-reducing bacteria
- Fumarate → used by some facultative anaerobes, including certain gut bacteria.
These alternatives yield less ATP than oxygen-based respiration because the alternative acceptors have lower reduction potentials, meaning less free energy is released per electron pair transferred.
Why the ETC matters clinically: inhibitors, hypoxia, and disease
Blocking the ETC at any point stops ATP production and can kill cells quickly. Classic inhibitors and their targets:
- Rotenone → Complex I (blocks NADH oxidation; used in pesticides and lab research)
- Antimycin A → Complex III (blocks the Q cycle; used experimentally)
- Cyanide (CN⁻) and carbon monoxide (CO) → Complex IV (bind the copper/heme centers, blocking O2 reduction)
- Oligomycin → ATP synthase (blocks the F0 proton channel, halting ATP synthesis without stopping electron flow)
AMBOSS distinguishes two mechanistically different interventions: inhibitors block specific enzymes or complexes, while uncouplers dissipate the proton gradient without making ATP. 2,4-Dinitrophenol (2,4-DNP) is the classic uncoupler — it carries protons across the membrane independently of ATP synthase, collapsing the PMF and causing the chain to run faster while producing heat instead of ATP. These are experimental and toxic compounds, not therapeutic agents.
Hypoxia stops Complex IV by removing its terminal electron acceptor. Electrons back up, the gradient collapses, and ATP production falls. Cells shift to anaerobic glycolysis, producing lactate and causing lactic acidosis. Prolonged hypoxia triggers cell death, which is the mechanism underlying ischemic injury in stroke and myocardial infarction.
Reactive oxygen species (ROS) are a byproduct of normal ETC function. When electron flow is impaired, electrons leak to O2 and form superoxide (O2⁻·). Excessive ROS damage proteins, lipids, and DNA. This is central to mitochondrial diseases — inherited defects in ETC complexes or assembly factors that reduce ATP output and increase oxidative stress. The lipid cardiolipin, concentrated in the inner mitochondrial membrane, stabilizes ETC supercomplexes (respirasomes); its loss impairs electron flow and amplifies metabolic vulnerability.
Respiratory complexes also form dynamic supercomplexes that optimize electron channeling and reduce ROS production. Disruption of supercomplex assembly is increasingly recognized in aging and mitochondrial pathology, making it an active area of research. The PGC-1 alpha pathway is one signaling axis that regulates mitochondrial biogenesis and ETC capacity in response to metabolic demand.
Analogies, misconceptions, and study tips for mastering the ETC
The hydroelectric dam analogy. Think of NADH and FADH2 as water stored at height. The complexes are the dam gates — they release energy in controlled steps rather than all at once. The proton gradient is the water pressure behind the dam. ATP synthase is the turbine. Open the gates in the wrong order, or block the turbine, and no electricity (ATP) gets made.
Common misconceptions to correct:
- “Glycolysis and the TCA cycle make most of the ATP.” They do not. Together they produce only 4 ATP by substrate-level phosphorylation per glucose. The ETC and oxidative phosphorylation account for the remaining 28–30 ATP, as AMBOSS confirms.
- “FADH2 is just a weaker version of NADH.” More precisely, FADH2 enters at Complex II, which pumps no protons, so fewer protons accumulate and less ATP results. The electron itself is not weaker — the entry point is different.
- “The ETC directly makes ATP.” The ETC builds the proton gradient. ATP synthase makes the ATP. These are two distinct processes coupled by the gradient.
- “Oxygen is used up by the complexes generally.” Only Complex IV reduces O2 to water. The other complexes do not interact with oxygen directly.
Active study tips:
- Draw the inner mitochondrial membrane from memory, placing all four complexes, CoQ, and cytochrome c in their correct positions. Label which side is the matrix and which is the intermembrane space.
- Practice P:O arithmetic: given 10 NADH and 2 FADH2, calculate approximate ATP yield (10 × 2.5 + 2 × 1.5 = 28 ATP) before checking against a full glucose calculation.
- Explain the Q cycle in one sentence out loud: “CoQH2 donates one electron to the Rieske Fe-S protein and one to cytochrome b, which reduces another CoQ to semiquinone, recycling the cycle and pumping extra protons.”
Pro Tip: Use the mnemonic “I, II, III, IV — 4, 0, 4, 2” to remember the approximate protons pumped per complex (Complex I: 4, Complex II: 0, Complex III: 4, Complex IV: 2). Write it in the corner of every practice diagram until it’s automatic.
Synthrolab and mitochondrial research compounds
For researchers investigating ETC function, mitochondrial signaling, or metabolic pathways, Synthrolab supplies research-grade peptides and laboratory compounds independently batch-tested for purity, each backed by a certificate of analysis. Whether your work touches on cellular recovery, metabolic modulation, or longevity mechanisms, Synthrolab’s catalog is built for serious laboratory use.
Explore research-grade peptides and compounds for mitochondrial and cellular signaling studies, or browse the full peptide basics guide to understand which compounds fit your research protocol. For researchers new to peptide-based experiments, the safe-start guide covers selection, reconstitution, and handling essentials.
For research use only. Not for human consumption.
The author’s perspective on learning the ETC
Mastering the electron transport chain is the single most clarifying step in understanding cellular metabolism — once you see that nearly all aerobic ATP flows from a proton gradient rather than from chemical bonds breaking directly, every other pathway (glycolysis, TCA, beta-oxidation) snaps into its proper supporting role. Students who struggle with this topic almost always have the same gap: they treat the ETC as a list of complexes to memorize rather than as an energy-conversion system with a coherent physical logic. Draw the membrane, place the gradient, and the rest follows.
Sources
The following references were used throughout this article and are recommended for deeper study:
Recommended
 21+ verification